Initialization
To initialize a chart object in an application you need to make the following steps:
- Include related js and css files
- Place a chart container on a page
- Define data for a chart
- Call an initialization script
1. First, add dhtmlxcharts.js and dhtmlxcharts.css files to use the methods of the DhtmlxChart library in an application.
   <script type="text/javascript" src="../../codebase/dhtmlxchart.js"></script>
   <link rel="STYLESHEET" type="text/css" href="../../codebase/dhtmlxchart.css">
2. Specify an HTML container for your future chart.
<div id=" chart_container" style="width:280px;height:250px;"></div>
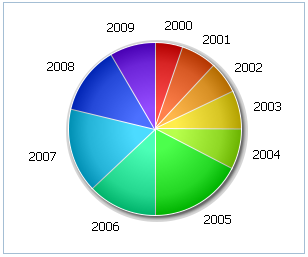
3. Specify data that will be present in a chart. They can have json, xml, csv or js array format.
var data = [
        { sales:2.9, year:"2000" },
        { sales:3.5, year:"2001" },
         …
        { sales:7.6, year:"2009" }
    ];
    chart.parse(data,"json");
4. Create an object constructor. It can have various parameters, but 3 parameters are mandatory in order for a chart to be rendered:
- view – a chart view (“bar”, “pie”, “ pie3D” or “line”)
- container – the id of an html container where chart will be initialized
- value – a data value that a chart presents (“value” by default)
All other parameters are optional.
  var chart =  new dhtmlXChart({
	view: "pie",
	container: "chart_container",
	value: "#sales#",
        label: "#year#"
    });